3.b) Preliminary analysis - Correlations between Wechsler and Stanford Binet scales
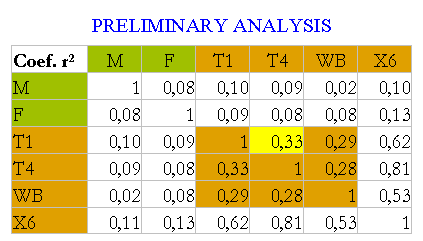
The first surprise is the observation of low correlations not only between the variable of the Mothers (M) and Fathers (F) with C (Children) but also among children variables, which correspond to the same children at different times. And not only the correlations between the two scales are not high but even between two IQ vectors of the same children with the Stanford Binet test.
The preliminary analysis of correlations of the involved variables, including Wechsler and Stanford Binet scales, helps to understand the technical hitches of the initial model of intelligence, the reasons for its reformulation, and even the convenience of performing a simulation to confirm the model's goodness-of-fit.
Wechsler and Stanford Binet test scales

The coefficient r² = 0.33 is the largest one among the IQ variables of the children (Wechsler, Stanford Binet, and another test). With this information, it seems hard to imagine high correlations between the children and their parents.
The initial model did not consider the previously mentioned grouping of values. To improve the results, the researchers thought about substituting the extreme values by their averages, but the different variables continued to show low associations.
These assessments of the low or not very high correlation among the children variables C imply the measurements are not very homogenous because there is agreement about IQ remaining stable after six years of age.
Given that the averages of the chosen variables were not equal, the team standardized them for a proper calculation of the centered variables X3 and X6. This technique is necessary to avoid distortions and any additional problems, considering that the model does not try to study the generational increase in IQ. Almost everybody accepts the growth, although different explanations on the subject exist. In The EDI Study, the best adjustment of the IQ data set of the children is 10% above the average of the mothers and fathers.
A consequence of the lack of IQ measurement precision is the impossibility to make a discretionary selection of 50% of the sample to isolate the cases in which supposedly the gene with less potential dominates; in agreement with the statistical model initially proposed.
Imagine having several photos or pictures of each child that, sometimes, do not look alike; but perhaps, altogether, they could give us a relatively clear image of the child.
Other factors contributing to the mentioned impossibility are the multifunctional character of human intellect and that, as the model depicts, the IQ of the child can be inferior to the smaller of the two parents. This aspect appears in more detail in other chapters.
As shown in the tables, this preliminary analysis has allowed recognizing the hitches to obtain satisfactory results and that it is better to use original values since their manipulation, although objective, does not improve the results significantly.
Also, the team tried centered variables with smoothed tails due to a limitation of a 10% deviance from the average (T1-d) and variables X3 (Wechsler, Stanford Binet test and another test) and X6, which are average values of three and six original variables respectively (observed values)
The solution will come with the model reformulation and a bit of imagination.
